On Network Design Spaces for Visual Recognition
Which metric is a better and more robust way to compare model families (e.g. ResNets vs VGG family) than the traditional way of point estimates or a curve estimate of a handful of picked models (see Fig 1 (a) and (b))
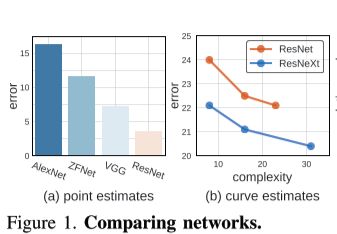
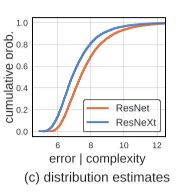
Comparing empirical distribution functions (EDFs) is a better way.
Specifically one can compare the **error EDF:
**
gives the fraction of models with error less than e.
What is an issue with the error EDF when comparing distributions of different network families, and how can it be solved?
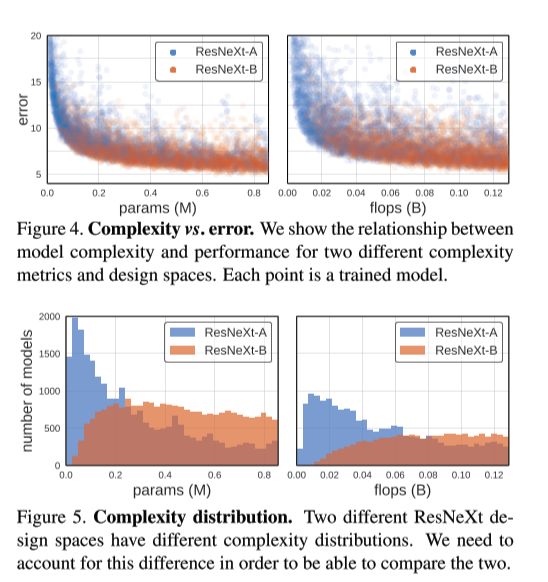
It does not control for confounding factors like network complexity. Model families which in general produce models of a larger complexity tend to have a better error.
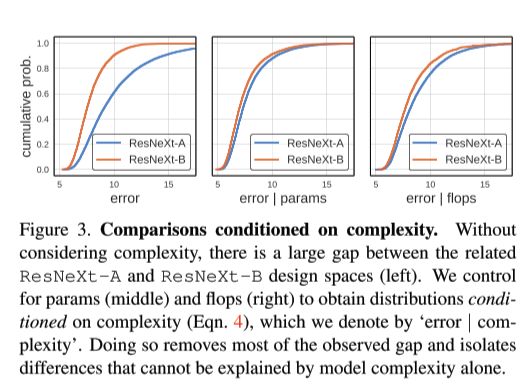
This can be solved by working with a normalized error EDF:
In practice, we set the weights for a model set such that its complexity distribution is uniform. Specifically, we bin the complexity range into bins, and assign each of the models that fall into a bin a weight .